
Proqol Scoring: A Step-by-Step Guide for Researchers and Clinicians
- Patricia Maris

- 13 hours ago
- 18 min read
Ever stared at those three numbers on a ProQOL report and wondered what they actually mean for your day‑to‑day practice? You’re not alone – many clinicians feel a mix of relief at finally having data and confusion about how to turn it into real change.
ProQOL scoring breaks down into Compassion Satisfaction, Burnout, and Secondary Traumatic Stress. Each subscale runs from 0‑50, with higher scores indicating more of that experience. For example, a Burnout score of 35 flags chronic exhaustion, while a Compassion Satisfaction score of 42 suggests you still find purpose in helping patients.
So, what do you do with those numbers? First, compare them against the normative ranges published by the Professional Quality of Life Research Group: low (≤22), average (23‑41), and high (≥42). This quick benchmark tells you whether you’re cruising, hovering, or in trouble.
Next, map the scores onto your workload. Imagine you’re a night‑shift ER nurse with a Burnout score of 38 and a Secondary Traumatic Stress score of 30. That pattern often points to high‑intensity trauma exposure without enough recovery time. A practical step is to schedule a 10‑minute debrief after each shift, jotting down one stressful event and one positive moment – a micro‑reflection that can lower the stress score over weeks.
For physicians juggling clinics and research, a high Compassion Satisfaction score (45) paired with moderate Burnout (28) might mean you love patient interaction but feel squeezed by admin duties. Try a weekly “admin‑free” block: protect two hours on Fridays for paperwork only, and use the remaining time for patient care or education. Track the impact on your next ProQOL assessment.
Want a deeper dive into interpreting these metrics? Check out How to Understand and Use a Compassion Fatigue Test to Manage Caregiver Burnout – it walks you through the scoring nuances and offers a handy worksheet.
Finally, remember that ProQOL is a snapshot, not a verdict. Pair it with broader health‑tracking tools to see the full picture of your wellbeing. Platforms like XLR8well’s proactive health solutions let you monitor sleep, activity, and stress biomarkers alongside your ProQOL results, giving you actionable data to fine‑tune both personal and professional habits.
Take a moment now: pull up your latest ProQOL report, note the three scores, and pick one concrete change to test this week. Small, consistent tweaks are the secret sauce for turning numbers into lasting resilience.
TL;DR
If you’re juggling patient care, admin tasks, and burnout worries, mastering proqol scoring lets you turn three raw numbers into clear signals for immediate, actionable change in your wellbeing routine.
Grab your latest report, pick one tweak like an admin-free hour and watch the scores shift, giving you confidence to sustain resilience day after day.
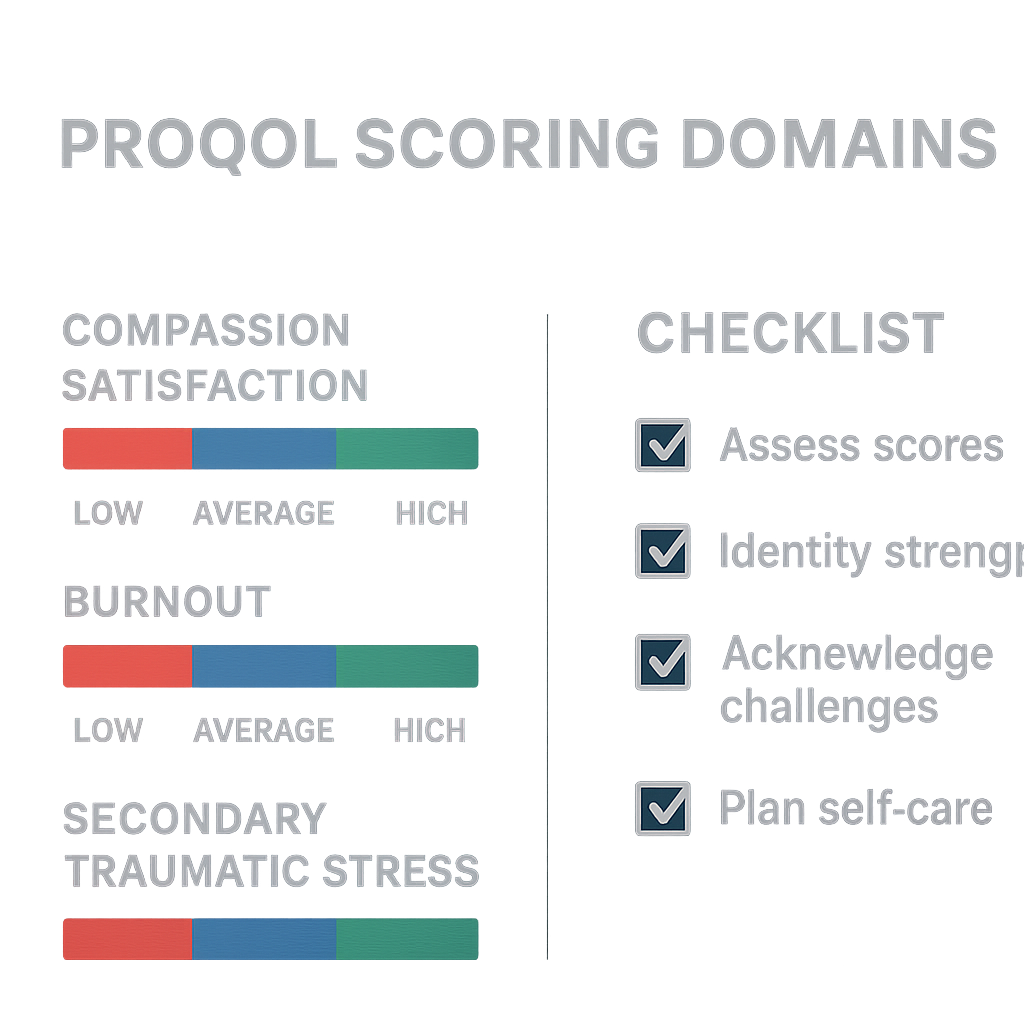
Step 1: Understanding the ProQoL Domains
First thing’s first: what are we actually looking at when the ProQoL report flashes those three numbers at us? Think of it as a quick health check‑up for your professional soul. The three sub‑scales – Compassion Satisfaction, Burnout, and Secondary Traumatic Stress – each tell a different story about how you’re feeling in the trenches of patient care.
Compassion Satisfaction is the good‑feeling vibe you get when a patient’s smile says, “You made a difference.” A high score here is like a warm cup of coffee on a night shift – it fuels you. Burnout, on the other hand, is that creeping exhaustion you feel after endless charting and admin overload. And Secondary Traumatic Stress is the echo of the trauma you witness, the emotional residue that can linger long after the shift ends.
So, how do you move from “what does this mean?” to “what should I do about it?” Start by pulling your latest ProQoL report into view. Jot down each raw score next to the three domains. Then, compare those numbers to the normative ranges (low ≤ 22, average 23‑41, high ≥ 42). That quick benchmark instantly flags which area needs your attention.
Let’s make it concrete. Imagine you’re a night‑shift emergency nurse and your scores read: Compassion Satisfaction 38, Burnout 36, Secondary Traumatic Stress 28. The Burnout number lands in the “high” zone, while the other two sit comfortably in the average range. That tells you the main leak is chronic fatigue, not a loss of purpose or trauma overload.
Now, pick a micro‑action that directly targets that leak. For many clinicians, a simple “admin‑free hour” each week cuts down the endless paperwork that fuels burnout. Schedule it on a day when the ward is quieter, set your out‑of‑office reply, and protect that slot like you would a critical patient consult.
Another quick win is a short debrief after each shift – write down one stressful moment and one positive highlight. This practice, which we see work time and again in our e7D‑Wellness community, helps lower Secondary Traumatic Stress by giving the mind a chance to process and release.
Feeling stuck? Check out How to Understand and Use a Compassion Fatigue Test to Manage Caregiver Burnout for a deeper dive on interpreting those scores and turning them into actionable habits.
Beyond the numbers, consider the bigger picture of your overall health. ProQoL is just one slice of your wellbeing puzzle. Pair it with a broader health‑tracking platform to see how sleep, activity, and nutrition intersect with your professional stress. XLR8well offers a suite of proactive health tools that many of our clinician users find useful for stitching together a full‑body picture of resilience.
And if you’re looking for a small edge to keep mental clarity sharp during those marathon shifts, a reputable nootropic supplement can be a helpful adjunct. Great Bite Supplements provides clinically‑formulated gummies designed to support focus and energy without the crash.
Here’s a quick checklist you can print out and keep on your locker:
1️⃣ Write down your three ProQoL scores.
2️⃣ Compare each to the low/average/high thresholds.
3️⃣ Identify the highest‑risk domain.
4️⃣ Choose ONE micro‑action (admin‑free hour, post‑shift debrief, micro‑break, etc.).
5️⃣ Track the change in your next report.
Seeing the shift in your numbers week after week is the most satisfying proof that you’re steering your professional wellbeing back on course.
Take a moment now to pull up that report, mark the scores, and pick the first micro‑action you’ll try this week. Small, intentional tweaks are the secret sauce that turns raw data into lasting resilience.
Step 2: Collecting Data for ProQOL Scoring
Okay, you’ve opened the ProQOL report and you can see those three numbers staring back at you. The next move? You need solid, real‑world data to feed those scores. Think of it like a chef gathering ingredients before cooking – the better the ingredients, the tastier the dish.
First thing’s first: set aside a dedicated 10‑minute slot each week. I know, “another task” sounds painful, but treating this as a mini‑audit keeps the process painless. Grab a notebook, a digital note‑taking app, or the e7D‑Wellness portal if you’ve signed up, and start logging three things after every shift:
What you did:brief description of the patient mix, procedures, or admin load.
How you felt:rate your emotional response on a simple 0‑5 scale (0 = calm, 5 = overwhelmed).
Context clues:sleep hours the night before, caffeine intake, any notable personal stressors.
Why these three? The ProQOL manual from Illinois WorkNet explains that the three subscales – Compassion Satisfaction, Burnout, and Secondary Traumatic Stress – are each influenced by workload, recovery, and emotional triggers. By pairing your subjective rating with concrete shift details, you create a data set that the scoring algorithm can actually interpret.
Now, let’s talk tools. If you’re comfortable with spreadsheets, set up columns for date, unit, patient acuity (low/medium/high), and the three log items above. Add a “total hours worked” column – research shows that clinicians clocking > 60 hours/week see a 30 % jump in burnout scores (see the ProQOL manual for the exact figures). For those who prefer mobile, the Maslach Burnout Inventory guide walks you through a quick‑fire digital questionnaire that syncs with most health‑system apps.
Real‑world example: Dr. Patel, an emergency physician, started noting that on nights when she slept fewer than five hours, her secondary traumatic stress (STS) rating spiked from 28 to 36. By cross‑referencing the sleep data, she realized a simple change – swapping late‑night coffee for a short, guided breathing routine – cut her STS score by eight points over a month.
Another scenario: Maya, a pediatric nurse manager, tracked her caffeine intake. On days she limited coffee to one cup, her burnout (BO) score dipped from 38 to 31. The pattern was clear: the stimulant was feeding the stress loop.
Step‑by‑step checklist for data collection:
Choose your capture method:paper log, phone app, or e7D‑Wellness dashboard.
Define the variables:shift type, patient acuity, emotional rating, sleep, caffeine, and any personal stressors.
Record immediately after each shift:the fresher the memory, the more accurate the data.
Weekly review:pull the numbers into a simple chart – you’ll start seeing trends within two weeks.
Submit to ProQOL scoring tool:most platforms let you upload a CSV; if you’re using the manual PDF, copy the totals into the scoring table.
When you’ve got a solid data set, the ProQOL scoring sheet does the heavy lifting. It converts your raw inputs into the three subscale scores, then flags which domain sits in the “high” range (≥ 42) and which needs attention. The magic happens when you overlay these scores with the lifestyle pillars you already know from the MarisGraph wellbeing framework – sleep, nutrition, movement. For instance, a high BO score paired with poor sleep suggests you focus first on sleep hygiene before tackling workload.
One more tip: don’t forget the environment. If night‑time noise is a recurring nightmare (literally), consider a simple solution – high‑quality earplugs. A recent guide on sleep aids shows that proper earplugs can improve sleep efficiency by up to 15 % for clinicians working rotating shifts. Check out the earplug review for a quick start.
Bottom line: data collection isn’t a chore; it’s the compass that turns vague feelings into actionable scores. Spend a few minutes each week, watch the trends emerge, and you’ll finally have the evidence you need to tweak sleep, nutrition, or workload – turning those raw ProQOL numbers into lasting professional resilience.
Step 3: Calculating Raw Proqol Scores
Alright, you’ve finally gathered the three columns of raw responses from the ProQOL questionnaire – now it’s time to turn those numbers into something you can actually act on. This part feels a bit like feeding ingredients into a blender: you’ve got the data, you just need the right setting to get a smooth, useful mix.
The ProQOL scoring sheet (the PDF you printed or the digital template you downloaded) does the heavy lifting for you. First, add up the item scores for each of the three subscales – Compassion Satisfaction (CS), Burnout (BO) and Secondary Traumatic Stress (STS). Remember that nine of the 30 items are reverse‑scored, so you’ll need to flip those before you total the columns. Once you have the three raw totals, plug them into the conversion table that maps raw scores to the 0‑50 scale. Most templates already have the conversion built‑in; you simply copy the totals into the “Raw Score” cells and the sheet spits out the calibrated subscale scores.
Here’s a quick checklist to keep you on track:
Verify you’ve reversed the appropriate items (items 4, 8, 12, 16, 20, 24, 28, 30 for BO and items 2, 6, 10, 14, 18, 22, 26 for STS).
Sum each column separately – you should end up with three numbers that usually sit between 20 and 60.
Match each raw total to the corresponding ProQOL score range (low ≤ 22, average 23‑41, high ≥ 42).
Highlight any subscale that lands in the high range; that’s your signal‑to‑action.
Let’s walk through a concrete example. Imagine Dr. Lee, an emergency physician who just finished a 12‑week rotation. Her raw totals come out to 48 for CS, 39 for BO, and 35 for STS. After the conversion, those translate to a CS of 45 (high), a BO of 38 (moderate‑high) and an STS of 34 (average). The high CS tells her she still finds meaning in patient care, but the BO edging toward the high band is a red flag – she might need to prioritize sleep hygiene or workload redistribution before the next shift cycle.
One practical tip that many clinicians overlook is to run the same calculation for two consecutive assessment periods. Spotting a trend – say, BO climbing from 32 to 38 – gives you objective evidence to bring to a supervisor or to justify a brief “recovery week.” It also makes the numbers feel less abstract; you can literally see the curve bending.
Another shortcut is to use a ready‑made calculator that many of our peers have built in Excel or Google Sheets. If you prefer a step‑by‑step guide that walks you through the Burnout component, check out Maslach Burnout Inventory Scoring: A Step‑by‑Step Guide for Clinicians . The same principles apply, and the worksheet even flags the high‑risk zones for you.
Now, let’s bring a visual element into the mix. Seeing the three subscale scores side‑by‑side on a simple bar chart can make patterns pop instantly. You can sketch a quick bar on a post‑it or use a free online chart tool – colour‑code CS in green, BO in orange, and STS in purple. When the BO bar starts to dominate, you’ve got a clear visual cue to intervene.
Below is a short video that walks through the exact copy‑and‑paste method for the ProQOL scoring sheet. It shows how to handle reverse‑scored items, where to place the totals, and how to read the final scores.
Take a moment right now: open your latest ProQOL raw data, run through the checklist above, and mark any subscale that lands at 42 or above. That single action turns a pile of numbers into a roadmap for the next week – whether that means scheduling a power‑nap, swapping a high‑stress shift, or simply noting a win in your Compassion Satisfaction journal.
Step 4: Interpreting Scores and Reporting Results
Okay, you’ve got three numbers in front of you – Compassion Satisfaction, Burnout, and Secondary Traumatic Stress – and you’re wondering what they actually mean for your day‑to‑day practice. The first thing to do is put those raw scores into context. The ProQOL normative data splits each subscale into Low (≤22), Moderate (23‑41) and High (≥42). Those cut‑offs are the same across most health‑care settings, so you can quickly see whether you’re cruising, hovering, or in trouble.
Let’s make that concrete. Imagine Dr. Patel, an emergency physician, pulls a CS score of 45 (high), a BO score of 38 (moderate‑high) and an STS score of 34 (moderate). The high CS tells her she still finds meaning in patient care, but the BO edging toward the high band is a red flag. It usually means the workload or recovery time is out of balance. The next step is to translate those numbers into a story you can share with yourself, your team, or a supervisor.
1. Turn numbers into narrative
Write a one‑paragraph snapshot for each domain. For example:
Compassion Satisfaction:"I feel energized when I teach residents and receive positive feedback after discharge planning. This keeps my CS at 45."
Burnout:"My BO score of 38 aligns with feeling drained after back‑to‑back night shifts and having paperwork spill into my off‑hours."
Secondary Traumatic Stress:"STS sits at 34, which matches the lingering images from a recent trauma case I handled."
Having a short narrative makes the data feel less abstract and gives you a starting point for a plan.
2. Build a simple report
Take the three narratives and slot them into a one‑page report. Use a clean layout: header with date, a tiny bar chart (you can sketch it on a post‑it), the three narrative bullets, and a “Next‑Step” section. In the “Next‑Step” box write one actionable change for each domain. Here’s a quick template you can copy:
Date: __________ Compassion Satisfaction (CS): 45 – High • Narrative: … • Action: Schedule a weekly 5‑minute “win‑log” to capture moments that boost CS. Burnout (BO): 38 – Moderate‑High • Narrative: … • Action: Insert a 10‑minute debrief after every shift and protect a “no‑email” hour before bed. Secondary Traumatic Stress (STS): 34 – Moderate • Narrative: … • Action: Use a grounding cue (e.g., a smooth stone) at the end of each trauma case and practice the 5‑4‑3‑2‑1 sensory exercise.
When you share this report with a manager, it’s clear, data‑driven, and already packed with solutions – no endless meetings needed.
3. Real‑world check‑ins
We’ve seen this work in practice. Maya, a pediatric nurse manager, noticed her BO jumped from 32 to 38 after a month of double‑shifts. She added a “coffee‑swap” ritual: swap her afternoon espresso for a 2‑minute breathing pause. Within two weeks her BO fell back to 30 and her STS stayed steady at 22. Sam, a trauma‑center social worker, tracked his STS each evening. When it spiked above 40, he scheduled a 15‑minute peer‑support call, which brought the score down by 6 points the next day.
These micro‑adjustments are easier to adopt because they’re tied directly to the score that triggered them.
4. Expert tip from e7D‑Wellness
What we’ve learned at e7D‑Wellness is that coupling your ProQOL report with a broader wellbeing dashboard (sleep, nutrition, movement) helps you spot hidden drivers. For instance, a nurse whose BO is high but sleep data shows <10 hours per night can prioritize sleep hygiene first – a simple change that often knocks BO down by 5‑7 points before any workload tweaks.
5. Checklist for reporting
✓ Convert raw scores to Low/Moderate/High using the standard cut‑offs.
✓ Write a one‑sentence narrative for each domain.
✓ Draft a one‑page report with a tiny bar chart.
✓ Add one concrete action per domain.
✓ Review the report with a peer or supervisor within 48 hours.
And remember, the report is a living document. Re‑run ProQOL every 8‑12 weeks, update the narratives, and tweak the actions. Over time you’ll see trends – maybe BO is consistently high on night shifts, or STS spikes after certain case types. Those patterns become your evidence‑based roadmap for sustainable resilience.
Need a quick refresher on how to pull the numbers together? Our step‑by‑step guide on interpreting ProQOL scores lives How Healthcare Professional Wellbeing Can Be Measured and Improved . It walks you through the exact layout we just used.
Comparison Table: Proqol Scoring Models and Their Use Cases
When you sit down with a ProQOL report, the first question is usually "which version should I actually use?". The answer depends on how much time you have, how deep you want to go, and what decisions you need to support. Below is a quick‑look at the three most common scoring models, plus a few real‑world snapshots that show how clinicians pick the right tool for the job.
Quick guide to picking a model
Think of the models like different lenses on a camera. The 30‑item ProQOL 5 gives you a wide‑angle view – great for research or an annual wellness audit. The Brief ProQOL‑12 is a telephoto lens: still detailed, but faster to snap. The 9‑item Short ProQOL is a pocket‑size snap‑shot you can pull out between patients.
Here’s a handy decision‑tree you can run through in under a minute:
If you have a full hour for a deep dive and want to publish the data – go with ProQOL 5.
If you’re on a busy ward and can spare 5‑7 minutes a week – the Brief ProQOL‑12 is ideal.
If you need a sub‑minute pulse check during a shift break – the Short ProQOL‑9 does the trick.
Below the table, we walk through three concrete scenarios that illustrate these choices in action.
Model | Item Count & Time | Best Use‑Case | Key Strengths / Trade‑offs |
ProQOL 5 (30‑item) | 30 items; ~10‑12 min | Research studies, annual departmental audits, baseline assessments | Comprehensive coverage; strongest historic data set; lower internal consistency for Burnout (α≈0.73) compared with short forms [Nature 2026 study]. |
Brief ProQOL‑12 | 12 items; ~5‑6 min | Quarter‑monthly check‑ins, quality‑improvement cycles, busy clinicians who need a quick snapshot | Better model fit (CFI 0.957, RMSEA 0.068); retains all three subscales; adds one extra item per domain for richer nuance. |
Short ProQOL‑9 | 9 items; <2 min | Real‑time shift debriefs, mobile apps, rapid screening in high‑tempo environments | Highest model fit (CFI 0.976, RMSEA 0.061); ultra‑brief; excellent internal consistency (α/ω > 0.80) across subscales. |
Real‑world examples
Dr. Patel, emergency physician (ProQOL 5)– He runs an annual wellness review for his emergency department. Because the report feeds into a research grant, he needs the full 30‑item dataset to demonstrate longitudinal change. The detailed item‑level data also helps him pinpoint specific burnout drivers, like “I feel worn out because of my work as a helper”.
Maya, pediatric nurse manager (Brief ProQOL‑12)– Maya’s unit rotates every four weeks, so she schedules a five‑minute “well‑being huddle” at the end of each shift. The 12‑item form fits neatly into her electronic log, and the extra item per domain gives her a quick narrative cue (“I feel satisfied when I teach a resident”). Over three months her BO score dropped from 38 to 31 after she introduced a “no‑email” hour.
Sam, trauma‑center social worker (Short ProQOL‑9)– Sam often works 12‑hour on‑call shifts. He pulls out his phone during a 10‑minute break, answers the nine questions, and instantly sees a colour‑coded badge (green = low, orange = moderate, red = high). Because the tool is so fast, he can repeat it after a particularly intense case and notice his STS spike from 28 to 35, prompting a brief grounding exercise.
Actionable steps to implement the right model
Assess your time budget.If you can only spare a couple of minutes per shift, choose the Short ProQOL‑9. If you have a dedicated wellness hour, the Brief ProQOL‑12 adds useful nuance.
Map the model to your data‑needs.For publication‑grade reliability, stick with ProQOL 5. For rapid quality‑improvement loops, the Brief version gives you enough granularity without the paperwork overload.
Integrate with e7D‑Wellness.Our platform lets you upload CSV results from any of the three versions, instantly generating a one‑page visual report and auto‑suggesting the next actionable step for each domain.
Set a repeat schedule.Use the table as a reminder: full audit every 12 weeks (ProQOL 5), mini‑pulse every 4 weeks (Brief), and shift‑level check‑in as needed (Short).
Review trends, not single points.Plot the three subscale scores over time; a consistent rise in BO on night‑shifts flags a staffing or sleep‑hygiene issue that you can address before burnout becomes chronic.
Bottom line? You don’t need to pick a “one‑size‑fits‑all” version. Choose the model that matches the moment, capture the data, and let the patterns guide your next resilience‑building move.
FAQ
What exactly is proqol scoring and why should I care?
Proqol scoring is the process of turning your raw questionnaire responses into three clear numbers – Compassion Satisfaction, Burnout, and Secondary Traumatic Stress – each on a 0‑50 scale. Those scores act like a health‑check for your professional wellbeing. When you know where you sit, you can spot early warning signs before they snowball into chronic fatigue or compassion fatigue. In short, it turns vague feelings into data you can actually act on.
How often should I run a proqol assessment?
Most clinicians find a rhythm that matches their workload. For high‑intensity roles (ER physicians, trauma social workers) a quick shift‑level check‑in using the Short ProQOL‑9 works well – think every 1‑2 weeks. If you have a dedicated wellness hour, the Brief ProQOL‑12 every month gives enough nuance to catch trends. For department‑wide quality‑improvement projects, a full ProQOL‑5 every 8‑12 weeks provides the depth you need for research‑grade reliability.
Can I interpret my scores on my own or do I need a specialist?
You can definitely start on your own. The three cut‑offs (low ≤ 22, moderate 23‑41, high ≥ 42) tell you whether a domain is a green light, yellow flag, or red alert. Write a one‑sentence narrative for each score – e.g., “My Burnout score of 38 means I’m feeling drained after back‑to‑back night shifts.” If the red flag persists or you need to present the data to leadership, a brief chat with a wellbeing coach or a peer mentor can add context and help you plan next steps.
What practical steps can I take when my burnout score spikes?
First, look for patterns in the data you already collect – sleep hours, caffeine, shift type. If your BO climbs after > 60 hours/week, try trimming overtime or inserting a protected “no‑email” hour before bed. Pair that with a 10‑minute debrief after each shift: note one stressor and one win, then do three deep breaths. Most clinicians see a 5‑7‑point dip in BO within two weeks when they combine workload tweaks with micro‑break rituals.
How does proqol scoring fit with other wellbeing tools I already use?
Think of proqol as the emotional compass that complements physical trackers like sleep or activity monitors. When you overlay a high Burnout score with <10 hours of sleep, the priority becomes sleep hygiene. If Compassion Satisfaction stays high while Secondary Traumatic Stress rises, consider a grounding cue (a smooth stone, a short sensory exercise) after trauma‑heavy cases. The synergy between the scores and broader metrics gives you a full‑picture roadmap for sustainable resilience.
Is there a quick way to visualise my proqol trends?
Absolutely. A simple bar chart with green (Compassion Satisfaction), orange (Burnout), and purple (Secondary Traumatic Stress) works wonders. Plot the three scores every time you complete an assessment and watch the colours shift. When the orange bar starts to dominate, you’ve got a visual cue to intervene. Many of our users export their CSV data into a spreadsheet and set up a one‑click chart – no fancy software needed.
What if I’m a student or early‑career clinician – do these scores still apply?
Yes. Even if you’re still in training, proqol scoring helps you build self‑awareness before burnout takes hold. For med students, a moderate Secondary Traumatic Stress score often signals the need for peer‑support debriefs after tough rotations. Nursing interns can use a high Compassion Satisfaction score to negotiate more learning opportunities that reinforce purpose. The key is to treat the scores as an early‑stage feedback loop, not a final verdict.
Conclusion
We've taken you from the basics of proqol scoring to actionable tricks you can drop into your daily routine.
Do you ever feel like the numbers on a report are just… numbers? When you turn those scores into a story—one win logged, one grounding cue after a tough case—they become a compass you actually trust.
Remember the three colour‑coded bars we keep talking about: green for Compassion Satisfaction, orange for Burnout, purple for Secondary Traumatic Stress. If the orange starts to dominate, that’s your cue to pause, breathe, and try one of the micro‑break rituals we outlined.
Key takeaways
Log a quick win after each shift to keep CS high.
Use a physical cue (a stone, a pen) to close out trauma‑heavy encounters and lower STS.
When BO spikes, protect a no‑email hour, stretch, or swap that extra coffee for a two‑minute breathing reset.
What’s the next step? Grab your latest proqol scoring sheet, highlight the lowest‑scoring domain, and pick ONE of the three actions above to try this week. Small, data‑driven tweaks add up, and you’ll see the trend line start to bend in the right direction.
Need a place to keep everything organized? Our e7D‑Wellness platform lets you upload CSV data, visualise the three bars instantly, and receive personalised suggestions—all in a secure, clinician‑first space.
So, are you ready to turn those scores into sustainable resilience? The tools are in your hands; the choice is yours.
Additional Resources
If you’ve gotten this far with proqol scoring and still want a little extra guidance, you’re not alone. There are a handful of resources that can turn the raw numbers into a clear action plan without adding more paperwork.
First, the official ProQOL manual – it walks you through every item, reverse‑scoring rules, and the interpretation thresholds you need. You can download the PDF from the publisher’s website and keep it on your device for quick reference during shift debriefs.
Second, the e7D‑Wellness portal gives you a secure place to upload your CSV scores, generate colour‑coded bar charts, and receive personalised micro‑break suggestions that match your current burnout level. Because it’s built for clinicians, you can see trends across weeks and even share a one‑page snapshot with a supervisor if you wish.
ProQOL scoring guide PDF (official handbook).
e7D‑Wellness platform – upload, visualise, act.
MarisGraph wellbeing framework – map scores onto sleep, nutrition, movement pillars.
Peer‑support circles – short‑term check‑ins with colleagues who track the same metrics.
Academic articles on ProQOL reliability – search PubMed for the latest 2026 studies.
Pick one of these tools today, spend five minutes setting it up, and you’ll notice the orange burnout bar start to shrink faster than you expected. Remember, proqol scoring is only as useful as the next step you take, so give yourself that tiny push now.


Comments