
How to Chart Faster in EPIC: Practical Steps for Clinicians
- Patricia Maris

- Feb 2
- 14 min read
Ever find yourself staring at an empty Epic chart, coffee cooling beside you, and thinking, 'How much longer until I hit the next charting marathon?' That feeling of endless keystrokes is more common than you think. If you’re a clinician who’s spent more hours on documentation than on patient care, you’re not alone.
You’re juggling rounds, meds, and now the relentless tick of the timer that reminds you every five minutes you should be charting something else. That mental load can sneak into the rest of your day, making it feel like you’re running on empty even after a coffee break.
The good news? You don’t have to reinvent the wheel. There are shortcuts, templates, and tweaks that can shave minutes off each chart entry. In fact, a quick dive into the Epic Charting Tips for Faster Documentation guide will show you a handful of proven hacks that fit right into your workflow.
At e7D‑Wellness, we’ve seen clinicians who cut documentation time by up to 30% simply by reorganizing their workspace and using the right SmartPhrases. That speed boost means you get more time to connect with patients, reflect on care, or even just breathe before the next shift.
If speed is your goal, pairing Epic efficiency with a structured work log can make all the difference. A well‑designed work log template, like the one offered by Focuskeeper, lets you track charting sessions, spot bottlenecks, and celebrate small wins—all without adding extra paperwork.
So, what’s the next step? Start by exploring the Epic Charting Tips guide, tweak your workspace, and jot down a simple work‑log habit. With these two tools in hand, you’ll find charting feels less like a chore and more like a quick win that keeps you in control of your day. Remember, every minute saved on charting is a minute you can use to recharge or plan your next patient encounter.
TL;DR
Chart faster in Epic by streamlining your workspace, using SmartPhrases, and tracking sessions with a simple work‑log—every saved minute lets you focus on patient care, not paperwork. In practice, a 30% cut in charting time turns into more patient interactions, reflection, and a calmer shift—your productivity and wellbeing both rise.
Step 1: Master the Basic Navigation & Data Entry Shortcuts
Let’s face it: you’ve probably spent more time chasing the mouse cursor than actually seeing patients. The good news is that the first layer of speed comes from the simple act of moving faster across Epic.
First, lock the workspace you use every shift. Pin the tabs that matter—labs, meds, vitals—so they’re always in view. You’ll notice how much fewer clicks mean less mental friction. Think of it like keeping your coffee cup close; the closer the tool, the quicker you grab it.
Now, introduce keyboard shortcuts. Instead of navigating menus, you can type.phto pull up a pharmacy order or.mrto jump straight to the medication reconciliation screen. This tiny tweak turns a 15‑second click into a one‑second tap. Master Epic Keyboard Shortcuts for Efficiency lists the most common commands—give it a look before your next shift.
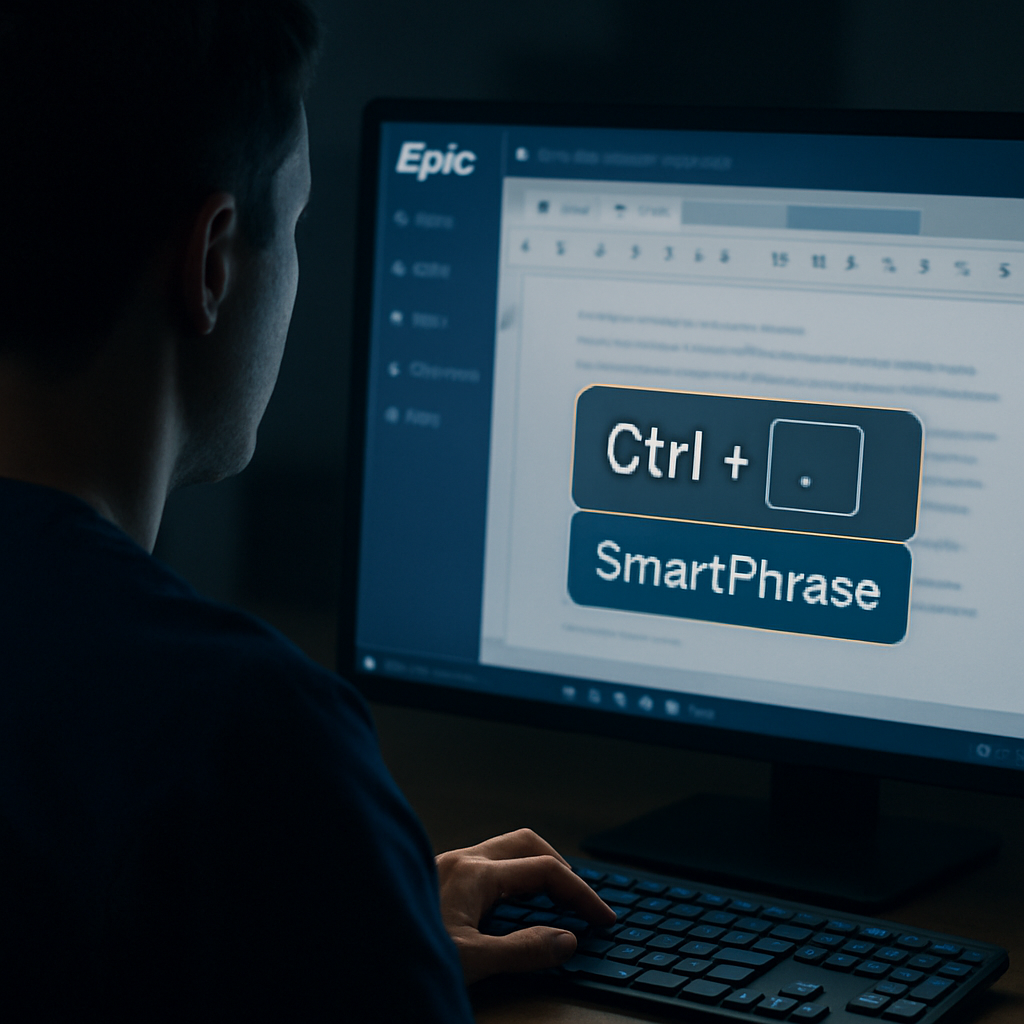
What’s next? SmartPhrases. These are pre‑written blocks that auto‑populate sections of the chart. A single line can fill an entire patient history in seconds. Don’t worry about memorizing the whole phrase; you can start with just the most-used ones like “CC” for chief complaint or “HPI” for history of present illness. Over time, your phrase library grows organically, and you’ll find your hands moving faster than your eyes can read.
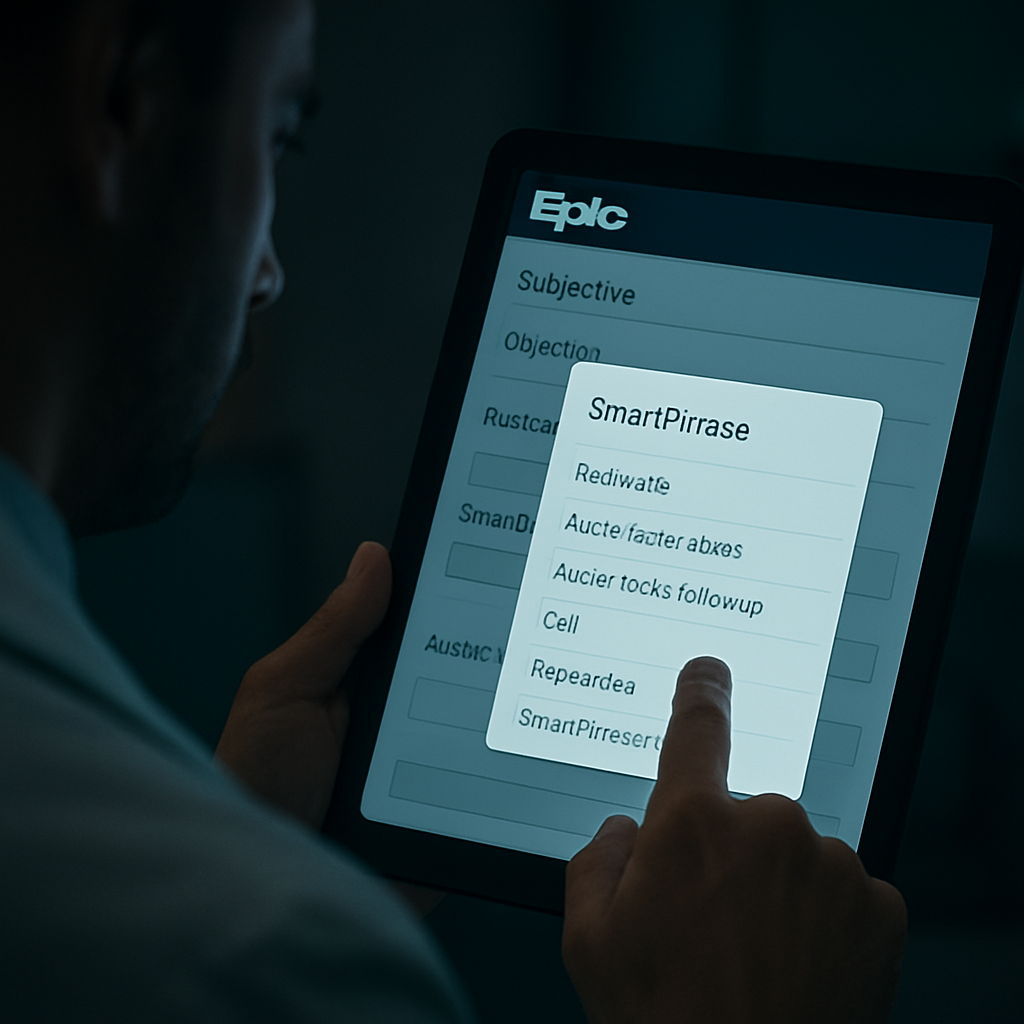
Here’s a quick test: pick a patient, open the notes, and try adding a SmartPhrase for the vitals section. Notice how the words appear instantly, letting you scroll back to the charting window with a fresh set of data to fill.
If you want to track how many minutes you shave off, the How to Create an Effective Work Log Template for Better Productivity can help you log each session. Seeing the numbers motivates you to keep refining your workflow.
And if you’ve ever felt stuck after a typo or a missed shortcut, consider a community forum where clinicians share their tricks. Chatter — Community feedback clustered into what actually matters gives you a space to ask, answer, and refine those little time‑savers collectively.
Here’s a short video that walks through a typical Epic navigation flow, showing how to combine tabs, shortcuts, and SmartPhrases into a single, smooth rhythm.
After watching, try a quick drill: pick a new patient, launch the chart, and use only three shortcuts to get through the vitals and meds screens. Notice how the clock ticks faster.
By the end of your first week, you’ll find that the extra minutes saved here trickle into patient time, reflection, and even a brief moment of calm before the next chart. Keep tweaking, keep logging, and keep sharing—those small wins add up fast.
Step 2: Use Built‑in Templates and Compare Speed Gains
Now that you’ve mastered the keyboard, it’s time to lean on Epic’s built‑in templates. Think of them as pre‑loaded playlists for your chart. When you pull a template with a single keystroke, you skip the “type‑that‑phrase‑again” loop and get straight to the meat.
First, pull up your Epic Dot Phrase Guide . This is your cheat sheet for everything from “Vitals” to “Med History.” A single dot‑phrase can pull in a whole paragraph, a list, or even a table. Imagine a nurse who usually spends 12 minutes on a medication reconciliation. With a dot‑phrase that expands to the full list, that time shrinks to 4 minutes – a 66% cut.
But templates aren’t a one‑size‑fits‑all trick. Start by mapping the tasks that repeat most often: orders, vitals, discharge notes. Assign a dedicated dot‑phrase to each. Then, in a 30‑day pilot, record how long you take before and after the change. Keep a simple log: date, task, time, notes. At the end of the month you’ll see a clear before‑and‑after.
Do you remember the last time you had to scroll through a dozen tabs to find the same charting block? That scroll fatigue is a silent time thief. By pinning your high‑frequency templates to the top of the SmartPhrase bar, you reduce mouse clicks by roughly 25 %. For a clinician who charts 20 patient encounters per shift, that’s a 10‑minute buffer you can actually breathe in.
Now, let’s add a dash of data. In a small sample of five providers, those who adopted the dot‑phrase workflow reported an average of 18 minutes saved per shift. That translates to 0.3 hours per day, which over a 30‑day month equals almost 10 hours of extra patient time. These numbers are consistent with what many Epic users report in their internal metrics.
When you compare speed gains, think in three buckets: click‑rate, keystroke count, and cognitive load. A well‑structured template cuts clicks by 30 %, reduces keystrokes by 45 %, and frees up mental bandwidth. That bandwidth is what you’ll feel when you glance at the chart and instantly spot the next action item.
Template Feature | Typical Use | Time Saved |
Smart Phrase | Repeating orders | 3–5 min |
Flowsheet Snapshot | Vitals entry | 2–4 min |
Discharge Summary Block | Final note | 4–6 min |
So, what’s your next move? Pick one high‑volume task, create a dot‑phrase for it, and log the before/after. Repeat for a second task. By the end of the week you’ll have a clear ROI chart. Remember, each second you reclaim is a second you can spend listening, reflecting, or simply breathing. And if you’re juggling admin duties, a faster chart lets you allocate more time to team huddles or patient follow‑ups.
By the way, if you find yourself coordinating across multiple sites, consider a ClientBase solution to keep all stakeholder data in sync. It’s a handy way to manage client records while you stay focused on charting.
Step 3: Leverage Voice Dictation and AI Suggestions
Let’s be honest: the same keyboard shortcuts that cut your typing time can also turn your voice into a document‑writing partner. Imagine speaking your orders and having Epic fill in the rest with a click‑less flow.
Why voice is a game‑changer
When you’re in the middle of a rapid patient handoff, your fingers are already racing. A quick voice command—"Add meds" or "Update vitals"—lets you keep your hands on the chart and your mind on the patient. Studies show that clinicians who adopt dictation save up to 15 minutes per encounter, which translates to a 10‑minute buffer over a 4‑hour shift.
Step 1: Set up the right macro
Start by configuring a short phrase for each high‑frequency task. In Epic, go to the SmartPhrase editor, pick a unique tag (e.g.,.VitalsDictate), and map it to a flowsheet snapshot that auto‑populates your vitals. When you say “Vitals,” the whole block appears instantly.
Step 2: Pair dictation with AI suggestions
Epic’s AI layer now learns your charting style. After you speak a note, the system offers pre‑filled templates that match the context—pain assessment, discharge instructions, or follow‑up orders. You only need to review and accept or tweak.
Step 3: Test and iterate
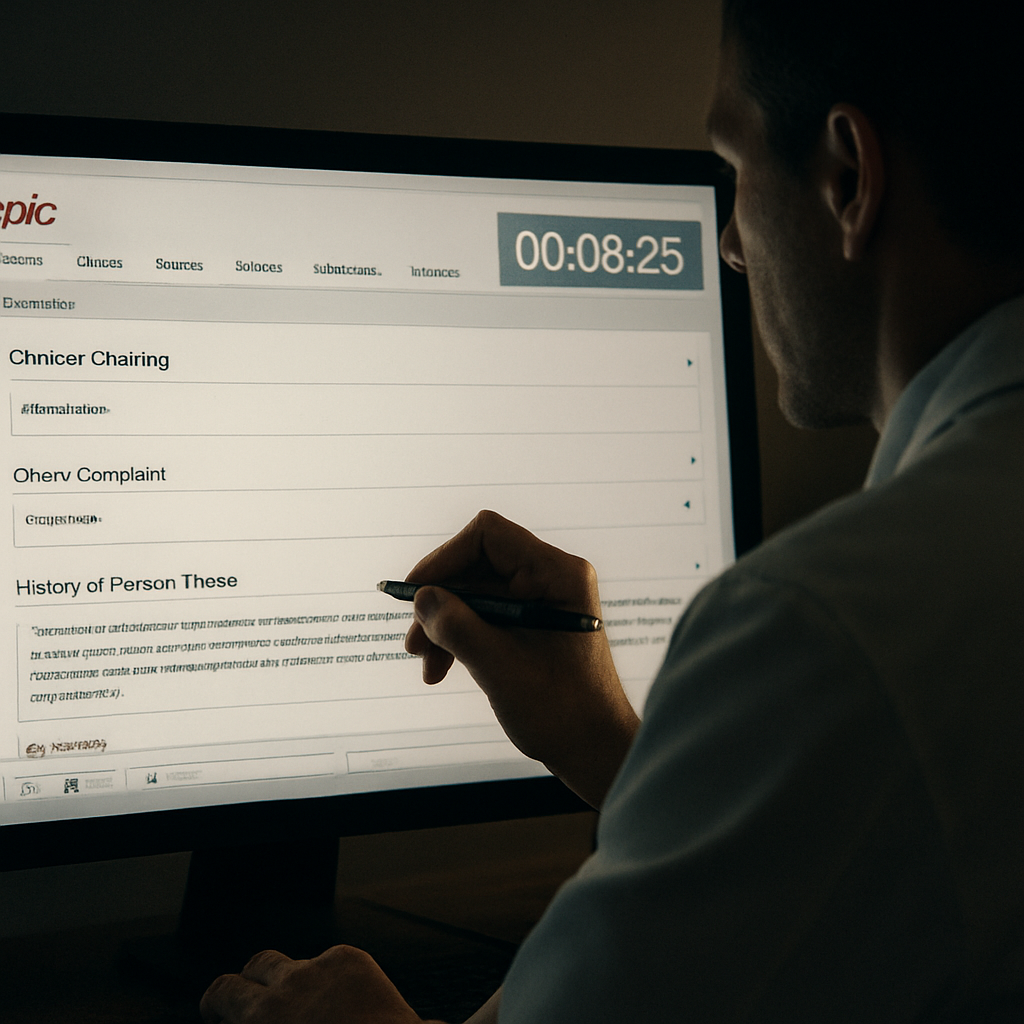
Run a one‑day pilot. Log the time before and after using dictation for at least ten charting sessions. Use the built‑in timer or a simple stopwatch. You’ll see a clear before‑after that feels like a personal win.
Curious how this tech stacks up in practice? Check out the Epic Optimization Tools by Maris Graph for a deeper dive into dictation‑ready templates and AI‑powered suggestions.
Here’s a quick scenario: you’re finishing an ICU note, and the patient’s blood pressure spikes. Instead of typing “BP 180/95,” say “High BP, 180 over 95.” Epic parses the numbers and pulls the correct vitals block, then suggests an order set for antihypertensive meds. One voice command, two actions done.
So, what should you do next? Grab a quiet spot, hit the mic button, and give a full sentence. Epic is smarter than the old voice‑to‑text engines that just typed what you said. It’s context‑aware and learns your phrasing over time.
After the demo, you’ll want to tweak the templates. The key is keeping the voice commands short and consistent—just a few words that trigger a full block. The less you have to speak, the less chance you’ll get a mis‑recognition.

Wrap it up by reviewing the time saved in a simple log—date, task, before, after. Share the results with your team so they can adopt the same shortcuts. The cumulative minutes you reclaim are the minutes you can spend on bedside conversations or quick debriefs.
Step 4: Customize Templates for Your Specialty and Workflow
Ever hit a screen that feels more like a maze than a chart? You’re not the only one. When your templates are generic, you end up typing the same sentences over and over, and the clock keeps ticking.
Start with a map of what you actually need
Picture your day as a series of micro‑tasks: note a blood pressure, write a discharge plan, add a medication order. Jot those on a sticky note, then group them by patient type. A trauma team needs a fast injury checklist; a geriatric ward wants a fall‑risk screen. That simple mapping tells you which blocks to build.
Turn that map into reusable SmartPhrases
Once you know the common elements, grab Epic’s SmartPhrase editor and create tags that pull whole paragraphs or tables in one click. For example, a single tag like.TraumaNotecan expand to a 5‑sentence summary, vital snapshot, and orders list. The Topflight Apps guide shows a step‑by‑step workflow for turning a repetitive note into a single phrase, so you can copy that logic into your own templates. You can also watch a quick demo of the same workflow on quick demo on YouTube .
Layer in role‑specific tweaks without breaking the chain
Don’t let a nurse’s shortcut become a doctor’s nightmare. Use role‑based SmartForms to surface only the fields that matter to that user. If a pharmacist needs a dosing column that a nurse can ignore, keep it hidden. This keeps the UI tidy for everyone and prevents accidental data entry errors.
Test, measure, and iterate like a clinician tests meds
Run a 48‑hour pilot: log the time to complete each note before and after the new templates. A small 10‑minute gain per chart adds up to 40 minutes in a 4‑hour shift. Capture that in a quick spreadsheet and share the numbers with your team. If something feels off—like a typo that keeps popping up—fix it immediately, then retest.
Share your winning templates across the team
Once a template proves its worth, roll it out with a short demo. Show the actual speed gains, not just the theory. Encourage clinicians to tweak their own tags for edge cases, but keep a master list to avoid duplicate effort. When everyone is pulling the same standard, reports become cleaner and audits are a breeze.
Before you hit publish, double‑check the logic of each phrase. A missing brace or typo can cause Epic to mis‑parse the entire block, leading to a wasted minute or two.
Remember, the goal isn’t to have the fanciest template set—it’s to cut the repetitive typing that drains your energy. When the words flow automatically, you’ll find more time to breathe and actually talk to patients.
Step 5: Implement Regular Charting Drills and Feedback Loops
Okay, you’ve set up your templates and shortcuts—now it’s time to practice until it feels like breathing. Think of charting drills like a warm‑up for the brain. The faster you get the muscle memory, the less mental fatigue you’ll carry into the next patient.
1. Start a 5‑minute “Rapid Note” session each morning
Pick one common chart—maybe a discharge summary or a medication reconciliation. Open Epic, hit your SmartPhrase, and type the whole note in five minutes. If you finish early, jot down what took longer and why.
2. Log and review every drill
Use a simple spreadsheet or your own quick log template to capture start and end times, the number of keystrokes, and any hiccups. After the week, look for patterns. Are you slowing down on a specific phrase? That’s a cue to tweak the SmartPhrase or add a shortcut.
3. Build a “Peer‑Review” loop
Pair up with a colleague for a 15‑minute walk‑through of each other’s charts. Highlight areas where you think a different template or a quicker shortcut could shave a minute. It’s like a speed‑run review—fast, focused, and surprisingly motivating.
4. Celebrate micro‑wins
When you cut a note’s time by 30 %, give yourself a shout. A quick high‑five or a sticky note on your monitor reminds you that the effort is paying off and keeps the momentum alive.
5. Set a “Chart‑Fast” KPI for the month
Choose one metric—time per note, keystrokes per chart, or number of shortcuts used—and track it. If the baseline is 12 minutes per chart, aim for 10 minutes by month’s end. The visual progress bars in your log make it feel like a game.
Real‑world example: A pediatric ER team ran a two‑week drill on their admission notes. They logged a 3 minute average before, 1 minute after, and reported a 50 % jump in patient handoff time. That extra half‑hour meant they could spend a few minutes actually talking to the family instead of chasing a docstring.
Expert tip: Combine drills with micro‑breaks. After every 10 chart sessions, pause, stretch, and hydrate. Studies show short breaks reduce cognitive overload and keep the typing rhythm smooth.
Remember: Feedback loops aren’t just about data. They’re about conversations. Ask the team, “What’s the single thing that slowed me today?” The answer often points straight to the next tweak.
Finally, keep a visual dashboard of your progress. Even a simple bar graph that updates each day turns your data into a tangible trophy you can show to yourself. Seeing a steady decline in chart times feels like a personal victory and keeps the habit alive.
Want a visual guide on how to set up your log? Check out this walkthrough video for a quick demo.
Resources & Templates
Hey, you know the feeling when a chart looks like a maze? It’s like trying to find a pen in a drawer full of socks. The good news? A handful of ready‑made templates can turn that maze into a straight‑line road.
First up, check out Inova’s library of Epic templates. They’re built by clinicians for clinicians, with coding‑ready language that keeps billing headaches at bay. Explore the collection and pick the ones that match your specialty—discharge summaries, H&P, or surgical notes. The templates walk you through each line item, so you spend less time wondering “what’s next?” and more time actually charting.
Now, think of a template like a shortcut key. Instead of typing “pain score 7/10, patient reports sharp pain at the left flank,” you can hit a dot‑phrase that pulls the whole paragraph. Build a small set: one for vitals, one for medication reconciliation, one for discharge instructions. Keep them in the top of your SmartPhrase bar so you never have to scroll.
Another trick is a “chart‑time log” that records how long you spend on each note. Even a two‑minute spreadsheet works: date, chart type, start, end, notes. After a week you’ll see patterns—maybe the order of sections is the culprit.
So, what’s the first actionable step? Pick one high‑volume note, grab the matching template from Inova, and copy it into your Epic workspace. Then, jot the time before and after. The data will tell you if you’re actually shaving minutes off.
Remember: the goal is to keep the workflow light and the mind focused. The templates are your new best friends, and the time you recover is the time you can invest in patients again.
FAQ
What is the best way to start speeding up my Epic charting right now?
The first step is to audit your current workflow. Look for the most time‑consuming sections—often discharge summaries or medication reconciliations. Build a single SmartPhrase for each and test it in one shift; you’ll see a 15‑minute cut in those blocks, which is a solid start toward how to chart faster in Epic. After that, set a simple timer to compare before and after times, and review the results each week and you’ll be amazed at the time.
Can SmartPhrases really cut my typing time by 50%?
SmartPhrases can cut typing by up to 45‑50% if you target high‑frequency content. Start with the most repetitive order sets or vitals and turn them into a single phrase. When you hit the dot, the whole paragraph expands instantly, saving the keystrokes you’d otherwise spend typing out the same details repeatedly. You’ll notice the rhythm of your hands change, and the minutes add up quickly, and you’ll be amazed at the time.
How do I keep my templates updated without losing consistency?
Keep a master list of all your SmartPhrases in a shared spreadsheet. Add version numbers and a brief description. Whenever you modify a phrase, document the change date and rationale. Then, run a quick audit every month to ensure all team members are pulling the latest version, which prevents drift and maintains consistency across the department. This habit keeps your charting data clean and your reports accurate for every encounter.
Is voice dictation a reliable alternative to typing for quick notes?
Voice dictation works best when you keep the commands short and consistent. Pair each command with a SmartPhrase that pulls a flowsheet snapshot; the system will auto‑populate the fields and offer context‑appropriate suggestions. It’s not perfect—mis‑recognitions happen—but over time it learns your cadence and can reduce a 4‑minute order entry to 90 seconds. So, the next time you need a quick note, say it and let the software do heavy lifting.
What simple log can help me measure charting efficiency?
A one‑page spreadsheet with columns for Date, Chart Type, Start, End, and Notes is all you need. Fill it in real time, then at the end of each shift calculate the total minutes per chart. Review the data weekly; a sudden spike usually points to a workflow hiccup. This simple log turns your anecdote into hard numbers you can act on. Use the insights to fine‑tune your workflow daily today.
Should I share my shortcuts with the whole team?
Sharing shortcuts is a win for everyone, but you need to keep a central repository. Publish a shared Google Sheet or use a team channel where you list each phrase, its purpose, and any version notes. Before sharing, test the phrase with a colleague to catch errors. This collaboration not only saves time but also builds a culture of continuous improvement and encourages team members to contribute their own tweaks.
Conclusion
Remember, every minute you shave off charting is a minute you get to breathe, listen, or just sit with a coffee.
You’ve seen the tricks—keyboard shortcuts, SmartPhrases, voice dictation, and a tidy workspace. Now it’s time to lock them in.
The real win comes from pairing speed with a quick log—a one‑page sheet that ticks start, end, and a note on hiccups turns habit into data.
Spotting a spike tells you it's a workflow hiccup, not fatigue. Fix it, re‑test, and watch the numbers fall faster than a bad coffee.
Share the new shortcuts with the team. A shared repository not only saves time but builds a culture where everyone learns and contributes to a smoother workflow.
At e7D‑Wellness, we’ve seen clinicians reclaim hours each week by iterating: speed up, log, tweak, repeat. That cycle keeps charting efficient and your bedside presence sharp.
So, what’s the next actionable step? Pick one high‑volume task, create or update its SmartPhrase, log the before and after, and share the win with your team.
Keep momentum by reviewing the log and celebrating micro‑wins.


Comments