

How to Use Clinician Wellbeing Dashboard
- Patricia Maris

- 17 hours ago
- 4 min read
Clinician burnout spikes when you can’t see the warning signs. The Clinician Wellbeing Dashboard turns raw data into a clear picture of risk. Follow these five steps to get the most out of the dashboard and start protecting your wellbeing.
Step 1: Access the Clinician Wellbeing Dashboard
Open a browser on any device and go to the e7D‑Wellness portal. The login screen asks for your work email or a free account you set up during the initial assessment. Once you’re in, look for the main navigation tab labeled “Wellbeing Dashboard.” Click it to load your personal view. You can also explore the physician stress level calculator for a quick snapshot of stress indicators.
The dashboard pulls data from the self‑assessment you completed last week. It updates nightly, so you always see the latest scores. Early detection is a key preventive step, and this tool gives you exactly that.
Take a moment to bookmark the dashboard URL. You’ll return here often, so a shortcut on your desktop or phone saves time.
Step 2: Set Up Your Wellbeing Profile
When the dashboard first loads, it prompts you to create a profile. Fill in basic details, role, department, typical shift length, and any recent changes in workload. This information lets the system weight each metric correctly. If you prefer a quick overview, try the free clinician wellbeing score calculator before completing the eight‑pillar questionnaire.
Next, answer the eight‑pillar questionnaire. The pillars cover sleep, nutrition, movement, stress, mental focus, social support, purpose, and recovery. Your answers generate a single percentage score that reflects overall wellbeing.
A similar questionnaire walkthrough can help you see how each question maps to a specific pillar.
After you submit, the dashboard shows a profile badge with your current overall score and a breakdown for each pillar.

Tip: Complete the profile in a quiet spot. Distractions can lead to rushed answers that skew your score.
Step 3: Handle Key Metrics and Visualizations
The top of the dashboard displays your overall wellbeing percentage. Right beneath it sit eight colored bars, each representing a pillar. Green means you’re above the 80% benchmark; amber flags moderate risk; red signals urgent attention.
Below the bars, a line graph plots your scores over the past three months. Hover over any point to see the exact value for that date. This trend view lets you spot improvements or slumps quickly.
On the right side, a heat map highlights which pillars have shifted the most week‑to‑week. Larger blocks mean bigger swings, which often point to emerging stressors.
Use the filter dropdown to view data by department, shift type, or location. This lets hospital leaders compare units without exposing individual identities. For deeper analysis, the doctor stress level estimator offers comparable visualizations.
Step 4: Interpret Insights and Identify Risk Signals
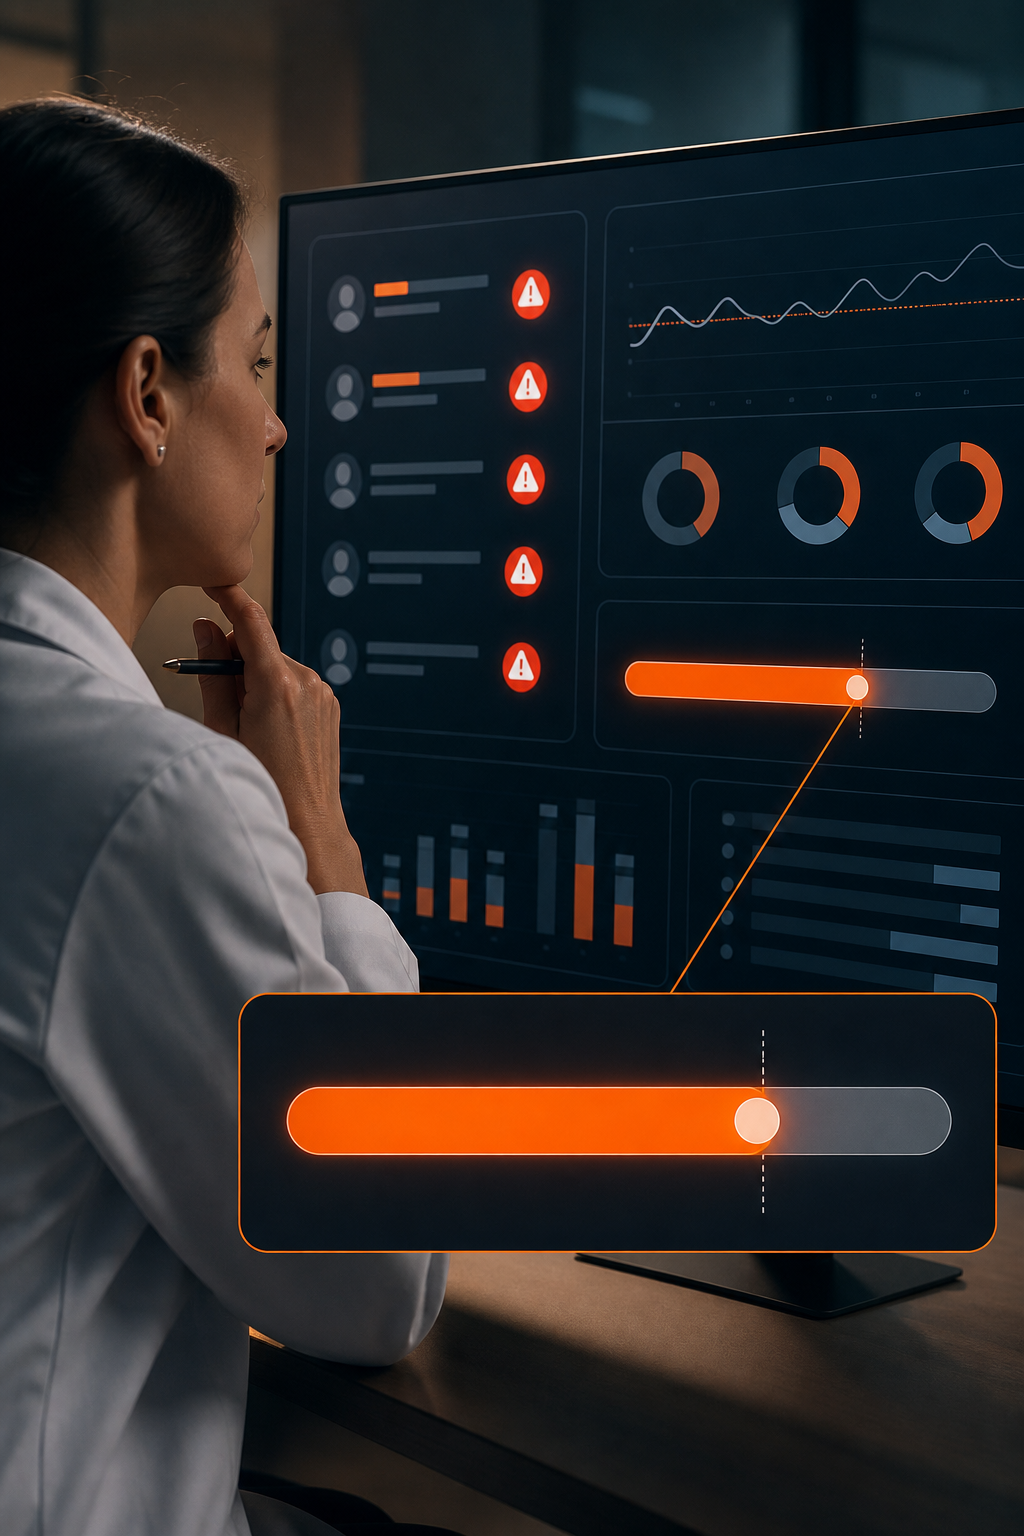
Start with the benchmark line that the dashboard draws at 80%. Anything below that line is a red flag. The research we ran on ten leading dashboards found only three set a clear benchmark, so this visual cue is a big advantage.
Look at the pillar that sits lowest. If “Sleep” scores 62%, the system suggests you’re at moderate risk for fatigue‑related errors. Click the pillar name to open a drill‑down panel with three actionable tips, such as “schedule a 20‑minute wind‑down routine after night shifts.”
Pay attention to the risk‑signal icons that appear next to any pillar that drops more than five points in a single week. These icons flash red and link directly to resource libraries. You may also want to review the physician resilience assessment guide for additional strategies.
Wikipedia’s entry on burnout explains how chronic low scores across multiple pillars compound overall risk, reinforcing why you should act on the strongest signals first.
Pro Tip: Export the current view as a PDF and share it with your supervisor during performance reviews. Having a visual record makes the conversation concrete.
Step 5: Take Action with Resources and Follow‑Up
Each pillar’s drill‑down panel lists evidence‑based resources, short videos, quick‑read articles, and guided exercises. Click “Open Resource” to launch a 5‑minute breathing pause or a 10‑minute stretch routine directly from the dashboard.
Pick one low‑scoring pillar and commit to a single habit for the next week. For example, if “Movement” is low, schedule a three‑minute standing stretch after each patient encounter.
Track your habit in the “Action Log” tab. The log timestamps each entry, so the dashboard can later overlay habit frequency on your score trend.
Guidance on setting SMART goals is available within the platform.
Return to the dashboard every month, retake the self‑assessment, and compare the new score to your baseline. If the overall percentage climbs above 80%, you’ve moved into a healthier zone. If it stays low, consider escalating to a peer‑support session or professional counseling, both linked in the resource library.
FAQ
How often should I check the Clinician Wellbeing Dashboard?
You should log in at least once a week to see any new alerts and to keep your habit log up to date.
Do I need special software to view the dashboard?
No special software is required; any modern web browser on a computer, tablet, or phone can display the dashboard.
Can I share my dashboard data with my manager?
Yes, you can export a PDF report from the “Share” button, which omits personal identifiers but shows all score trends.
What if my overall score never reaches 80%?
Treat the dashboard as a guide, not a final verdict; focus on incremental improvements in the lowest pillars and res regularly.
Is the data on the dashboard secure?
All data is encrypted at rest and in transit, complying with HIPAA standards to protect clinician privacy.
Use the dashboard, act on the insights, and watch your wellbeing improve over time.
Conclusion
e7D‑Wellness offers the most complete dashboard with an 80% benchmark and eight‑pillar view. Set up your profile, explore the metrics, act on the risk signals, and revisit each month to stay ahead of burnout.
Ready to put this into practice? e7D-Wellness was built for exactly this.


Comments